StrikeWatch EA
Institutional Options Analytics for MetaTrader 5
StrikeWatch EA transforms your standard price chart into a Dealer-Level Workstation.
Visualize the hidden market structure — from dark pool flows to gamma exposure — directly on your MT5, giving you the clarity professionals pay thousands for.
On-Chart & GUI Engine
Transform MetaTrader 5 into a Pro-Grade Options Workstation
Augmented Reality Overlays
Don't trade blind. The engine projects institutional liquidity directly onto your price chart.
- 5-Dimension Strike Histograms: See the full depth of every price level. Dynamic bars for Call/Put OI, Call/Put Volume, and Dollar Gamma per strike.
- Net GEX Profiles: Color-coded horizontal bars (Green for Positive Gamma, Red for Negative) show dealer positioning to predict support vs. acceleration zones.
- Zero-Lag Rendering: Overlays update instantly without freezing your chart, even during high-volatility events.
Auto-Pilot Strategic Levels
Stop drawing lines manually. StrikeWatch plots the statistical "walls" for you.
- Volatility Bounds: Real-time projection of ADR (Average Daily Range) and IV Daily Range bands to spot statistical exhaustion.
- Dealer Magnets: Automatically plots the Zero Gamma Level (Volatility Trigger) and Max Pain (Pin Target) as dynamic horizontal lines.
- Expected Move: Dual projection based on Implied Volatility (IV) and Historical Volatility (HV) to gauge market pricing vs. reality.
Institutional Coverage
Trade the same universe as the big desks with deep historical context.
- US Blue Chips: Built-in support for top liquidity names including NVDA, TSLA, AAPL, MSFT, META, GOOGL, AMD, AMZN plus major banks (JPM, GS).
- Deep Volume Memory: The engine caches 2 months of tick-level volume data (7 weeks), allowing you to analyze accumulation zones far beyond standard intraday charts.
- Full Term Structure: Process up to 10 expiration dates simultaneously, from 0DTE scalps to LEAPS positioning.
X-Ray Vision Tooltips
Get granular data without leaving the price action.
- Mini Option Chain: Hover over any strike on the chart to reveal Delta, Gamma, Theta, Skew, and live Bid/Ask spreads in a pop-up card.
- Instant Pricing: Check the exact cost of an option at any strike directly from the chart overlay.
- Seamless Inspection: No need to open separate windows—just point your mouse at a level to see who is defending it.
Modular Command Panel
Your central dashboard for market analysis.
- 8 Specialized Modules: Switch instantly between Summary, Volatility, Greeks, News, Inside, and more via a unified tab system.
- Sync-Lock Technology: The Panel and Chart are one ecosystem. Change an expiration date in the GUI, and the chart overlays update instantly to match.
- Adaptive Resolution: The interface automatically scales to fit your setup, looking perfect on both laptops and 4K multi-monitor stations.
Smart Volume Controls
Advanced Auction Market Theory tools at your fingertips.
- One-Click Time Travel: Dedicated footer buttons let you jump to any specific week from the last 2 months instantly.
- Dual Modes: Toggle between "Regular" (Session) and "Cumulative" (Composite) volume profiles with a single click to spot long-term value areas.
- Comparison View: Overlay "Today's Profile" vs. "Weekly Profile" to see if intraday value is accepting or rejecting longer-term levels.
Specialized Analytical Modules
Each module gives you a dedicated institutional-grade MT5 options analytics view – from volatility and gamma to fundamentals, flows, news and on-chart profiles.

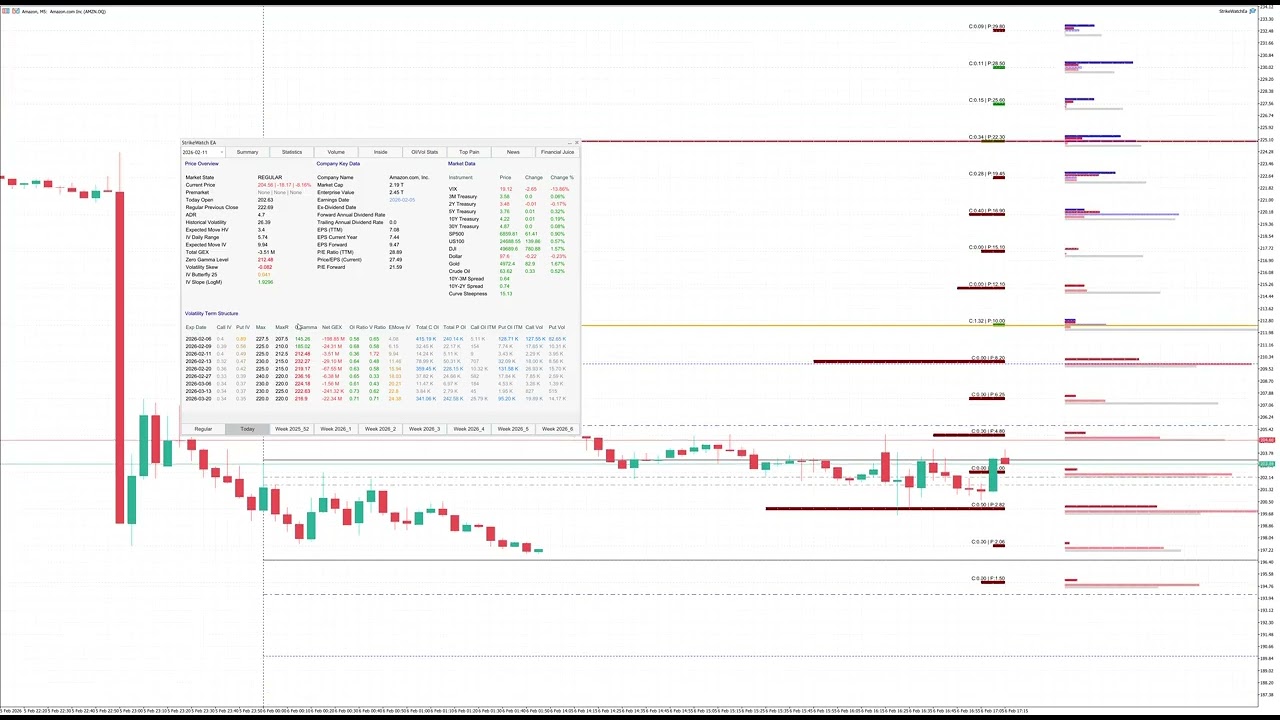
Summary Surface
The Institutional "Command Center" for MetaTrader 5
Stop switching between browser tabs and your trading platform. The Summary Surface aggregates real-time options microstructure, fundamental data, and macro correlations into a single, dealer-grade dashboard directly on your MT5 chart.
- Price & Volatility Context: Instantly compare Implied Volatility (IV) vs. Historical Volatility (HV). Visualize the Expected Move range to determine if price action is contained or breaking out. Includes pre-market data and ADR monitoring.
- Gamma Exposure (GEX) Engine: Track the Net GEX and the critical Zero Gamma Level (ZGL) to identify dealer hedging levels and potential support/resistance zones derived from option flows.
- Advanced Skew & Structure: Go beyond simple IV. Monitor Volatility Skew (25 Delta RR), Kurtosis (Butterfly 25), and IV Slope to detect structural shifts in market sentiment before price reacts.
- Dynamic Term Structure: A heatmap-style view of the full option chain. Analyze Max Pain, Open Interest (OI) distribution, and Volume profiles across all expiration dates to spot where the big money is positioned.
- Macro & Fundamentals Watch: Keep an eye on the broader market without leaving the chart. Live feeds for VIX, Treasuries (Yields), Crude Oil, Gold, and SPX/NDX alongside key company metrics like Earnings Dates, Dividend Yields, and P/E Ratios.

Advanced Statistics
Complete Fundamental "Due Diligence" inside MT5
Most options traders overlook fundamentals because checking them is inconvenient. The Statistics module delivers a complete financial health check of any company—from valuation to liquidity—allowing you to filter out low-quality trades in seconds.
- Valuation & Multiples: Quickly assess if a stock is cheap or expensive. Access key ratios like P/E, PEG Ratio, EV/EBITDA, and Price-to-Sales in a single, structured view.
- Financial Health & Liquidity: Avoid "bull traps" in highly leveraged companies. Monitor Debt/Equity, Current Ratio, and Net Cash Position directly on your chart to gauge bankruptcy risk.
- Profitability & Efficiency: Analyze business quality using Gross, Operating, and Net Margins, along with return metrics like ROE and ROA. See instantly if the company is generating real value or just burning cash.
- Cash Flow Dynamics: Watch what matters most—cash. Track Free Cash Flow (FCF) and Cash Flow per Share to evaluate the company's ability to fund growth or execute share buybacks.
- Analyst Consensus & Dividends: Know the street's sentiment. View analyst ratings, Price Targets (Mean/Median), and a full dividend profile (Yield, Payout Ratio, Ex-Date) for income-focused strategies.

Volume Intelligence
Automated VSA & Liquidity Density Scanner
Don't just look at volume bars—understand the *intent* behind them. This module uses a proprietary Liquidity Density algorithm to classify every trading session, helping you distinguish between institutional accumulation and retail traps.
- Smart Move Classification: The system automatically tags sessions based on Volume/Range relationship. Instantly spot "Valid Moves" (Institutional backing), "Liquidity Vacuums" (Stop runs on thin volume), and "Absorption" (Hidden accumulation).
- Liquidity Density Metric: A unique formula (Volume / Range) that reveals how "thick" the order book was. High density means real business; low density often signals a fakeout or a "gap and trap" scenario.
- Anomaly Detection: The engine automatically filters out statistical noise (e.g., half-days or holidays) to prevent skewed data, highlighting only the sessions with abnormal participation.
- Contextual Heatmaps: Visual gradients for Volume, Range, and Liquidity allow you to read the last 30 sessions in seconds. Identify weekly patterns and recurring liquidity cycles at a glance.
- Breakout Validation: Stop chasing fake breakouts. Use the "Ranking" column to confirm if a price surge is supported by High Liquidity Density or if it's just a price vacuum likely to reverse.

Insider Intelligence
Follow the "Smart Money" & Short Squeezes
Price charts show you *what* happened. Insider data shows you *who* is making it happen. Track real-time C-suite buying, institutional accumulation, and short-seller positioning to align your trades with the most informed players in the market.
- C-Suite & Insider Transactions: Don't guess—know. See the last 15 filings directly on your screen. Filter by Buy vs. Sell to spot when CEOs and CFOs are loading up shares (Cluster Buying) or dumping them.
- Short Squeeze Detector: Advanced Short Interest analytics including Short Ratio (Days to Cover) and changes in Short Volume vs. Prior Month. Identify overcrowded shorts ripe for a squeeze before the explosion.
- Institutional Ownership: Gauge the "quality" of the shareholder base. Compare Insider Holdings vs. Institutional Holdings to see if the stock is retail-owned or backed by "diamond hand" funds.
- Governance & ESG Risk: A hidden layer of risk management. Monitor Audit Risk and Management Compensation Risk to avoid companies with red flags in their corporate governance structure.
- Net Flow Sentiment: A synthesized "Net Shares" metric that aggregates buying vs. selling pressure, giving you a clear directional bias from the people who know the company best.

OI/Volume Statistics
Dealer Positioning & Pin Risk Scanner
Decode the game theory between dealers and the market. This module goes beyond raw numbers to interpret the structural risk of the option chain. Spot "Pin Risks" where price is likely to stall and "Gamma Explosions" where dealers are forced to chase the trend.
- Automated Gamma Risk Interpretation: The engine analyzes ATM (At-The-Money) concentrations to flag potential Price Pinning zones or high-volatility events. It explicitly tells you if the market is in "Hedging Mode" or "Speculative Mode".
- Real-Time Options Tape: A live feed of the last 30 largest trades. See the actual tape with execution timestamps, prices, and Ask/Bid data to spot Smart Money aggression as it happens.
- ITM vs. ATM Positioning: Understand the intent. The system separates defensive In-The-Money (ITM) positioning from speculative At-The-Money (ATM) bets, calculating distinct Activity Ratios to reveal if volume is just rolling or new aggression.
- Top 15 Strikes Scanner: Instantly visualize the "Walls". See the Top 15 strikes for Open Interest and Volume side-by-side to identify key support/resistance levels derived from the options market, not just technicals.
- Net Gamma & GEX Balance: Track the total positive vs. negative Gamma Exposure (GEX) for any expiration. Know immediately if dealers are providing liquidity (stabilizing price) or amplifying volatility.

Max Pain Calculator
Decode Market Maker Incentives
Markets tend to gravitate toward prices that cause the most financial pain to option buyers. The Max Pain module calculates the precise dollar value of total payouts at every strike, revealing the "Zero-Cost Zones" where Market Makers are incentivized to pin the price at expiration.
- Precise Pain Ranking: Don't just see one number. View the full Pain Curve across all strikes to identify local minima and the range where dealer payouts are minimized.
- Strike Magnets & Pinning: The engine highlights strikes with the highest potential "gravity." Use this to anticipate price stalling (Pinning) into Friday close as dealers hedge their gamma exposure to zero.
- Local Pain & Range Analysis: Beyond the global Max Pain, the system calculates Range Pain (`local_pain_value`) to find relevant targets within the current trading volatility, ignoring unrealistic deep OTM levels.
- Volume & OI Share Gradients: Instantly spot where the crowd is positioned. Heatmap gradients for OI % and Volume % show you exactly which strikes are "heavy" and likely to act as support or resistance walls.
- Put/Call Ratio per Strike: Micro-level sentiment analysis. See the Put/Call balance for individual price levels to determine if a specific support level is bullish (put selling) or bearish (put buying).

News & FinancialJuice
Real-Time Catalyst Intelligence
Never be blindsided by a headline again. StrikeWatch integrates two distinct high-speed news engines: a ticker-specific feed for company earnings/PRs and the institutional-grade Financial Juice stream for global macro events and central bank breaking news.
- Company-Specific News (Micro): Algorithmic feed pulling the latest 30 headlines for your active ticker. Instantly spot earnings releases, SEC filings, and product announcements that drive implied volatility shifts.
- Financial Juice Integration (Macro): Access the same "Squawk" text feed used by professional desks. Monitor Central Bank statements (Fed/ECB), geopolitical shocks, and flow data that move the entire market, not just one stock.
- One-Click Source Verification: Don't trust; verify. Every headline is clickable, opening the full source article or Financial Juice report directly in your browser for deep-dive research.
- Asynchronous Speed: Built on a high-performance async Python backend, the news engine updates in the background without freezing your MT5 terminal, ensuring your price data remains lag-free.
- Catalyst Synchronization: Finally, see the "Why" next to the "What." Correlate price spikes and volume anomalies on your chart directly with the timestamped news event that caused them.

On-Chart "Head-Up Display"
Augmented Reality for Your Price Chart
Don't trade blind. The Graphics Manager projects invisible market structure directly onto your candles. It turns your standard MT5 chart into an institutional HUD (Head-Up Display), visualizing the "Dark Matter" of options liquidity that drives price action.
- 5-Dimension Strike Histograms: See the full depth of every price level. The engine renders dynamic bars for Call/Put OI and Volume, plus a dedicated Dollar Gamma ($Gamma) bar to visualize dealer hedging intensity per strike.
- Critical Level Overlays: Automatically plots the Zero Gamma Level (Volatility Trigger), Max Pain (Pin Target), and Expected Move Bounds (based on both IV and HV) so you know exactly where the statistical walls are.
- Interactive Smart Tooltips: Hover over any strike to reveal a complete data card: Full Greeks (Delta, Gamma, Theta), Volatility Skew, and live Bid/Ask spreads. It's like having an options chain pop-up on every candle.
- Net GEX Profile: Color-coded horizontal bars (Green for Positive Gamma, Red for Negative) show you the net dealer positioning at every price, helping you predict support (dampening) vs. acceleration zones.
- Integrated Volume Profile: Seamlessly blend options structure with auction theory. Overlay daily or weekly Volume Profiles alongside the options data to spot high-confluence trade locations where liquidity aligns.
Licensing Options
Choose the plan that fits your trading needs. All plans include the full MT5 EA. Cancel anytime.
Basic
$49
per month (excl. VAT)
- MT5 native EA
- 200+ equity metrics
- On-chart overlays
- Full modules stack
- Market: Nasdaq 100 & S&P 500
- AI & Tech: Apple · Nvidia
- Finance: JPMorgan · Goldman Sachs
- Mega Cap: Amazon · Tesla · Meta
Pro
$89
per month (excl. VAT)
- MT5 native EA
- 200+ equity metrics
- On-chart overlays
- Full modules stack
- ✅ Everything in Basic, plus:
- Big Tech: Microsoft · Google
- Semiconductors: Broadcom · AMD · Palantir
- Media & Payments: Netflix · Visa
- Energy: ExxonMobil
- E-Commerce & Cloud: Alibaba
- Fintech: PayPal
- ⭐ Special discount offers access
Enterprise / Elite
$129
per month (excl. VAT)
- MT5 native EA
- 200+ equity metrics
- On-chart overlays
- Full modules stack
- ✅ Everything in Pro, plus:
- Finance+: Bank of America · Morgan Stanley · BlackRock
- Value & Industrials: Berkshire · Walmart · Caterpillar
- Software: Oracle · Salesforce · IBM · Intel
- Healthcare: UnitedHealth · Eli Lilly
- Energy: Chevron
- Consumer: Home Depot
- AI Infrastructure: Micron · Super Micro
- Digital Assets: Coinbase · Strategy (MSTR)
- Automotive: Ford
- Aerospace & Defense: Rocket Lab
- Beta features — pre-release access
- Roadmap influence
- ⭐ Special discount offers access
SIMPLE 4-STEP INSTALLATION
Native MetaTrader 5 Expert Advisor – no external software, from blank chart to a full options analytics workstation in under two minutes.
Install the EA file
Copy the compiled StrikeWatchEA.ex5 file into your MT5 MQL5/Experts folder. Refresh the Navigator panel or restart MetaTrader 5 to load the Expert Advisor.
Configure WebRequest access
Go to Tools > Options > Expert Advisors. Check "Allow WebRequest for listed URL" and add the API endpoint (provided in your welcome email) to the whitelist.
Attach & Start
Drag StrikeWatch EA onto any chart and paste your License Key. The EA automatically recognizes the instrument and loads the data instantly. If needed, you can adjust the index symbol names to match your broker in the Nasdaq 100 and S&P 500 fields.
Start Analyzing
The panel will auto-load. Use the top navigation tabs to switch between modules like Summary, Volatility, or Greeks. Select an expiration date to instantly sync the on-chart overlays.
MetaTrader 5 Options Trading: Community Scenarios & Predictions
Live market analysis from professional traders using StrikeWatch EA. See how institutional data translates into actionable trading scenarios.

Microsoft (MSFT)
Feb 25, 2026 (Live Updated: Mar 21)Microsoft’s $380–$390 Volume Floor and the March Gamma Squeeze Setup
Microsoft has been trading above a massive $380–$390 volume floor, with options positioning and dealer hedging initially pointing to an upside gamma squeeze into the March 20 “Triple Witching” expiration.
Live Status (Mar 21): The short-term squeeze into March OPEX has played out differently than projected. MSFT slid into expiration near the $380 floor instead of squeezing toward $420–$450, while a potential legal dispute around a large OpenAI–Amazon cloud deal has added a new strategic risk overhang. However, the fact that heavy OPEX flows were ultimately absorbed just above $380, without a clean break lower, also strengthens this zone as a potential long-term structural floor. Any renewed push higher now depends on reclaiming $395–$400 and de-escalation of this AI-related headline risk.
The Current View:
- The $380–$390 volume node has been reaffirmed as the key support zone after March OPEX, with $395–$400 now acting as a critical pivot for any sustained upside.
- Targets in the $420–$450 zone stay on the table medium term, but require both price acceptance back above $400 and a cleaner backdrop around the Microsoft–OpenAI–Amazon relationship.
Disclaimer: This is not financial advice. This is a personal view based on options data and market structure analysis.
Upgrade Your MetaTrader 5 Terminal with StrikeWatch EA
StrikeWatch EA is now live. Stop trading with retail tools. Get the full institutional stack — GEX, Dark Pools, and Volatility Analytics inside MetaTrader 5 right now.
One-Click Integration
No external platforms. No browser tabs. Just one MT5 EA file that transforms your chart into a volatility workstation.
Join Discord Community for 20% OFF
We reward our community. Join our Discord server today to grab an exclusive 20% Lifetime Discount code valid for your subscription.
Lock-in "Legacy" Status
Current monthly subscribers will be grandfathered into exclusive annual plan discounts arriving mid-year. Early support pays off.
Currently offering Monthly plans to ensure maximum stability and rapid updates. Annual plans launching Q3 2026.